Is Thomastown Safe? Understanding Local Crime Data
Thomastown is an ordinary outer-northern Melbourne suburb with a crime profile that is higher than some leafy areas and in line with many comparable suburbs. Most of what gets reported is property crime, not violence against strangers. The honest answer depends on which numbers you read and how you read them, so this guide shows you how to do that yourself. If you are new to the area, the Thomastown guide covers the wider picture.
I am not going to quote a single figure and call it final. Crime numbers change every quarter, and a number without context misleads. What I can do is show you where the data lives, what each category means and what to watch for.
Where Does Reliable Crime Data for Thomastown Come From?
The best source is the Victorian Crime Statistics Agency. It is an independent body that publishes recorded crime data for the whole state. It does not work for the police, and it does not sell homes. That matters.
The agency draws its numbers from reports made to Victoria Police. So the figures show crime that was reported and recorded, not every crime that happened. Keep that in mind for everything below.
You can filter the data by suburb, by postcode and by local government area. Thomastown, Victoria sits inside the City of Whittlesea. That council area is one of the many Local government areas of Victoria the agency reports on, and it is a big one. A figure for the whole council covers many suburbs with very different streets.
When I first helped a friend check Thomastown before a rental move, we started with the council figure. It looked worse than the suburb figure. The council number was pulled up by other areas. We only got a fair view once we switched to suburb level.
What Do the Crime Statistics Actually Count?
Crime statistics in Victoria use a set of offence divisions. Two matter most to home seekers. One is property and deception offences, which include theft and burglary. The other is crimes against the person, which include assault.
An Offence against the person is a crime committed against another human being. That sounds frightening, and the label is broad. It covers a fight between two people who know each other, a family assault and a rare attack by a stranger. A raw count does not tell you which one dominates.
This is where most readers go wrong. They see a number in that category and picture a stranger on the street. In my experience, the data rarely supports that picture. A large share of these offences happen between people who already know each other, often at home.
How Does Thomastown Compare With the Suburbs Around It?
Compare like with like. Put Thomastown beside Lalor, Victoria and Epping, Victoria. They share a border or a short drive, similar housing and similar transport. If all three sit close together on the rate of offences per 100,000 people, Thomastown is typical for its area.
Use rates, not raw counts. A suburb with more people will record more offences even if each resident faces the same risk. The agency publishes rates per 100,000 so you can compare fairly.
Be careful with the other direction too. Do not compare Thomastown with a small, wealthy suburb and conclude it is dangerous. Do not compare it with the Melbourne central business district either. The city centre records a huge number of offences because of crowds, nightlife and shopping. Its numbers are inflated by visitors who do not live there. Neither comparison tells you much about living in Thomastown.
One of my clients almost walked away from a rental in Thomastown after seeing a headline number. When we lined it up against Lalor and Epping using rates, the gap shrank to almost nothing. She signed the lease and has stayed.
What Types of Crime Show Up Most?
In suburbs like this one, the largest category is usually theft of some kind. That includes theft from a vehicle, theft from a shop and break-ins. These crimes are about opportunity. An unlocked car or a visible bag on the seat invites them.
Motor vehicle theft
Motor vehicle theft has been a statewide concern in recent years. Thomastown is not special here. Cars left unlocked, keys left inside and older models without modern immobilisers are the usual targets. Wide driveways and open carports give thieves easy access.
You control more of this risk than you think. Lock the car. Take the keys inside, and keep them away from the front door. Park in a garage if you have one. A friend who lives nearby had a car taken once, and it turned out the spare key sat in a bowl near the entrance. That is a common story.
Drug-related crime
Drug-related crime appears in the data as possession, use and trafficking offences. Be careful reading this line. A high count can mean more drug use. It can also mean more police activity, because these offences are mostly found when police look for them. A suburb with an active police operation records more cases than a quiet suburb with the same level of use.
So a spike does not always mean things got worse. It can mean enforcement went up. Check whether the change lasts across several quarters before you draw a conclusion.
Domestic violence
Domestic violence, also called family violence, is recorded in its own right in Victoria. Reports of it are high in many suburbs, and that is partly good news. Victoria has worked to get victims to report. A higher count can reflect more people coming forward.
This type of harm happens inside homes. It poses little risk to you as a visitor or a neighbour walking past. It is still a real problem for the people living through it. If you or someone near you needs help, contact Victoria Police or a family violence support service.
Why Can Crime Mapping Mislead You?
Crime mapping tools show dots or colours across a suburb. They look clear, and they feel authoritative. They also hide a lot.
A map often places an offence at the nearest address or the nearest major intersection. A theft from a shopping centre car park pins to the shopping centre. The centre then looks like a hotspot, even though it simply draws thousands of people each day. The dot shows where something was reported, not where you would be at risk on an ordinary evening.
Maps also use different time windows. One shows twelve months, another shows five years. Look at the date range before you compare two maps. Check the legend too. Dark red can mean ten offences on one map and a hundred on another.
Use crime mapping to spot patterns near a specific address, such as a cluster near a particular station or shopping strip. Do not use it to judge the whole suburb. For the whole suburb, go back to the rates.
What Does the Trend Tell You That a Snapshot Does Not?
A single year can be an outlier. A trend over three to five years tells you far more. Is the rate rising, flat or falling? Is the change sharp or slow?
Look at the specific offence too. A rise in one category, such as vehicle theft, can drive the headline figure while everything else stays flat. I tell clients to ignore the overall total and read the lines underneath it. The total hides the story.
Also watch for changes in how crime is recorded. When the law or the police system changes, the counts can jump without any real change on the street. The Victorian Crime Statistics Agency notes these changes in its releases. Read the notes before you panic over a jump.
What Does Community Policing Add to the Picture?
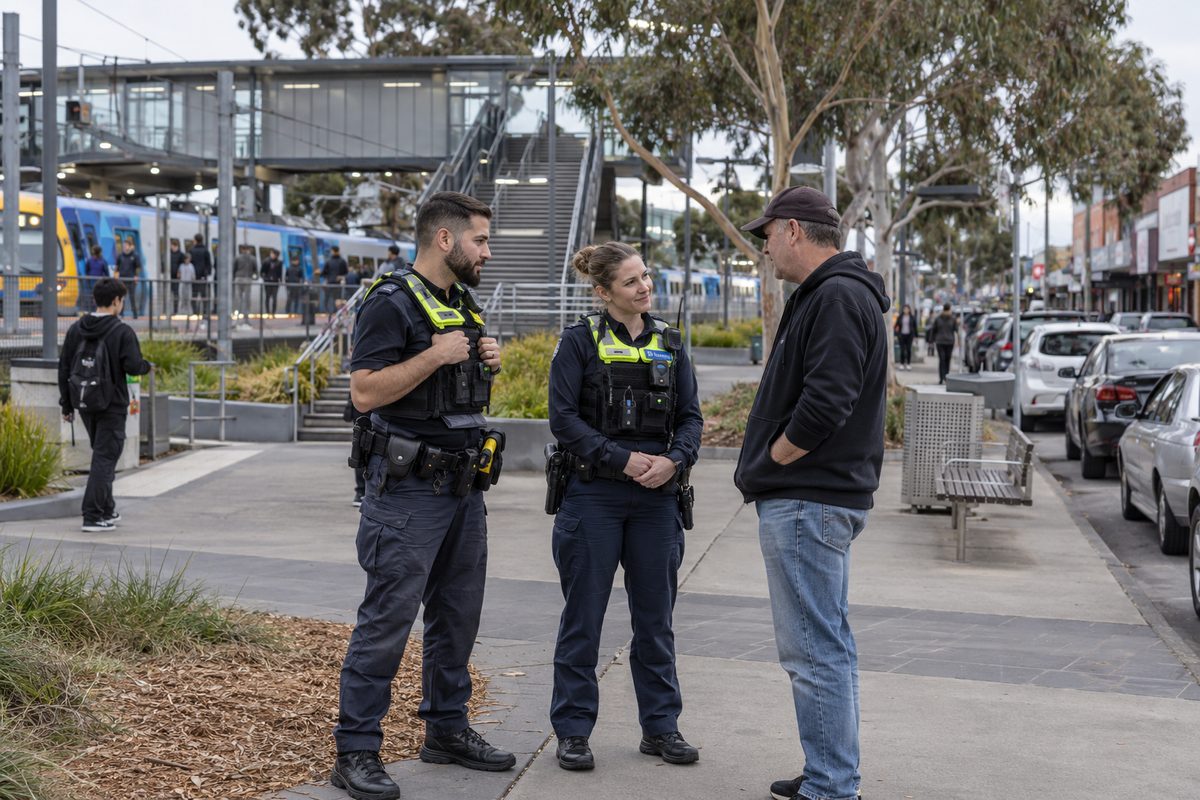
Numbers do not show how a place responds to crime. Community policing does. This is the approach where officers work with residents, schools, traders and local groups to prevent problems before they start.
You can see it in practice. Police attend local meetings. Neighbourhood watch groups share alerts. Traders talk to officers about repeat offenders. Victoria Police also runs local engagement programs in the City of Whittlesea area, and the council supports lighting, graffiti removal and safer public spaces.
When I talked with a local shop owner about this, she said the thing that changed her sense of safety was knowing the officers by name. That did not show up in any statistic. It still shaped how she felt walking to her car at closing time.
How Do You Check Your Own Street?
Suburb data tells you about the average. You live on one street. Here is how to get specific.
- Open the Crime Statistics Agency data and select Thomastown at suburb level. Note the rate per 100,000 for the latest year.
- Do the same for Lalor and Epping, and write the three rates side by side.
- Look at the five-year trend for each offence type that worries you.
- Use a crime map to see whether offences cluster near your address or near a shopping strip some distance away.
- Visit the street at three different times: a weekday morning, a weekday evening and a Saturday night. Check lighting, parked cars and who is around.
- Talk to a neighbour. Ask what they would change about the street. Their answer is often more useful than a dataset.
Do the walk before you sign anything. I know this because a client skipped it once. The data looked fine, but the street had poor lighting near the train line and she felt uneasy every night. A twenty-minute evening visit would have shown her.
What Are Common Mistakes When Reading Crime Data?
- Using counts instead of rates. Bigger populations always record more offences.
- Judging the suburb by the council area. The City of Whittlesea covers many suburbs with very different numbers.
- Treating reported crime as all crime. Some offences are never reported, and some are reported more than others.
- Reading one bad quarter as a trend. One quarter can be noise.
- Ignoring the type of offence. A theft of a bike and an assault are very different risks, but both can sit inside a broad headline figure.
So What Is the Real Risk for a Resident?
For most people, the risk is theft of property. That means a stolen car, a stolen parcel or a break-in. These are annoying and costly, and they are also largely preventable with simple habits. Lock doors. Use lighting. Park carefully. Do not leave valuables visible.
Serious harm to a stranger on the street is far less common than the headlines suggest. Harm inside the home is the larger share of violence, and it is not something a suburb choice can predict.
The practical way to think about it is this. Thomastown is not a place to avoid, and it is not a place to ignore common sense. It behaves like the suburbs around it. If you take normal precautions, you face a normal level of risk for outer Melbourne.
Your Next Step
Open the Victorian Crime Statistics Agency suburb data tonight. Compare Thomastown with Lalor and Epping using rates per 100,000. Then walk the exact street you are considering after dark. Those two actions will tell you more than any headline.